---
title: "Moving a thousand site maps from PDF to runtime for a national homebuilder"
sector: "U.S. residential homebuilding"
role: "Sr Solutions Architect"
duration: "~ 3 months, 2024"
pillar: "Runtime over artifact"
sub: "Replacing designer-updated PDF community maps with a live availability platform - and retiring the bottleneck that kept them stale."
---

## § 01 — context

### The work

Lennar, the largest homebuilder in the United States, told buyers what was available the same way it had for years: a PDF site plan for each community, updated by hand in Adobe tools every time a home sold, changed price, or broke ground.
Sales managers walked buyers through availability using documents that could be out of date before the conversation ended.

I was brought in to replace that workflow with a web-based mapping system: real-time availability, pricing, and status, from the regional search view down to the individual lot on a community site plan.

## § 02 — the constraint that mattered

### The map was a design artifact; availability is runtime data

The old process treated availability as a design deliverable.
Every change routed through a designer, which meant the accuracy of a sales conversation depended on a production queue.
The interesting problem was getting the designer out of the update loop without losing the craft that made the maps legible: lot lines aligned to architectural plans, community features you could actually recognize, status you could read at a glance.

<div class="diagram">
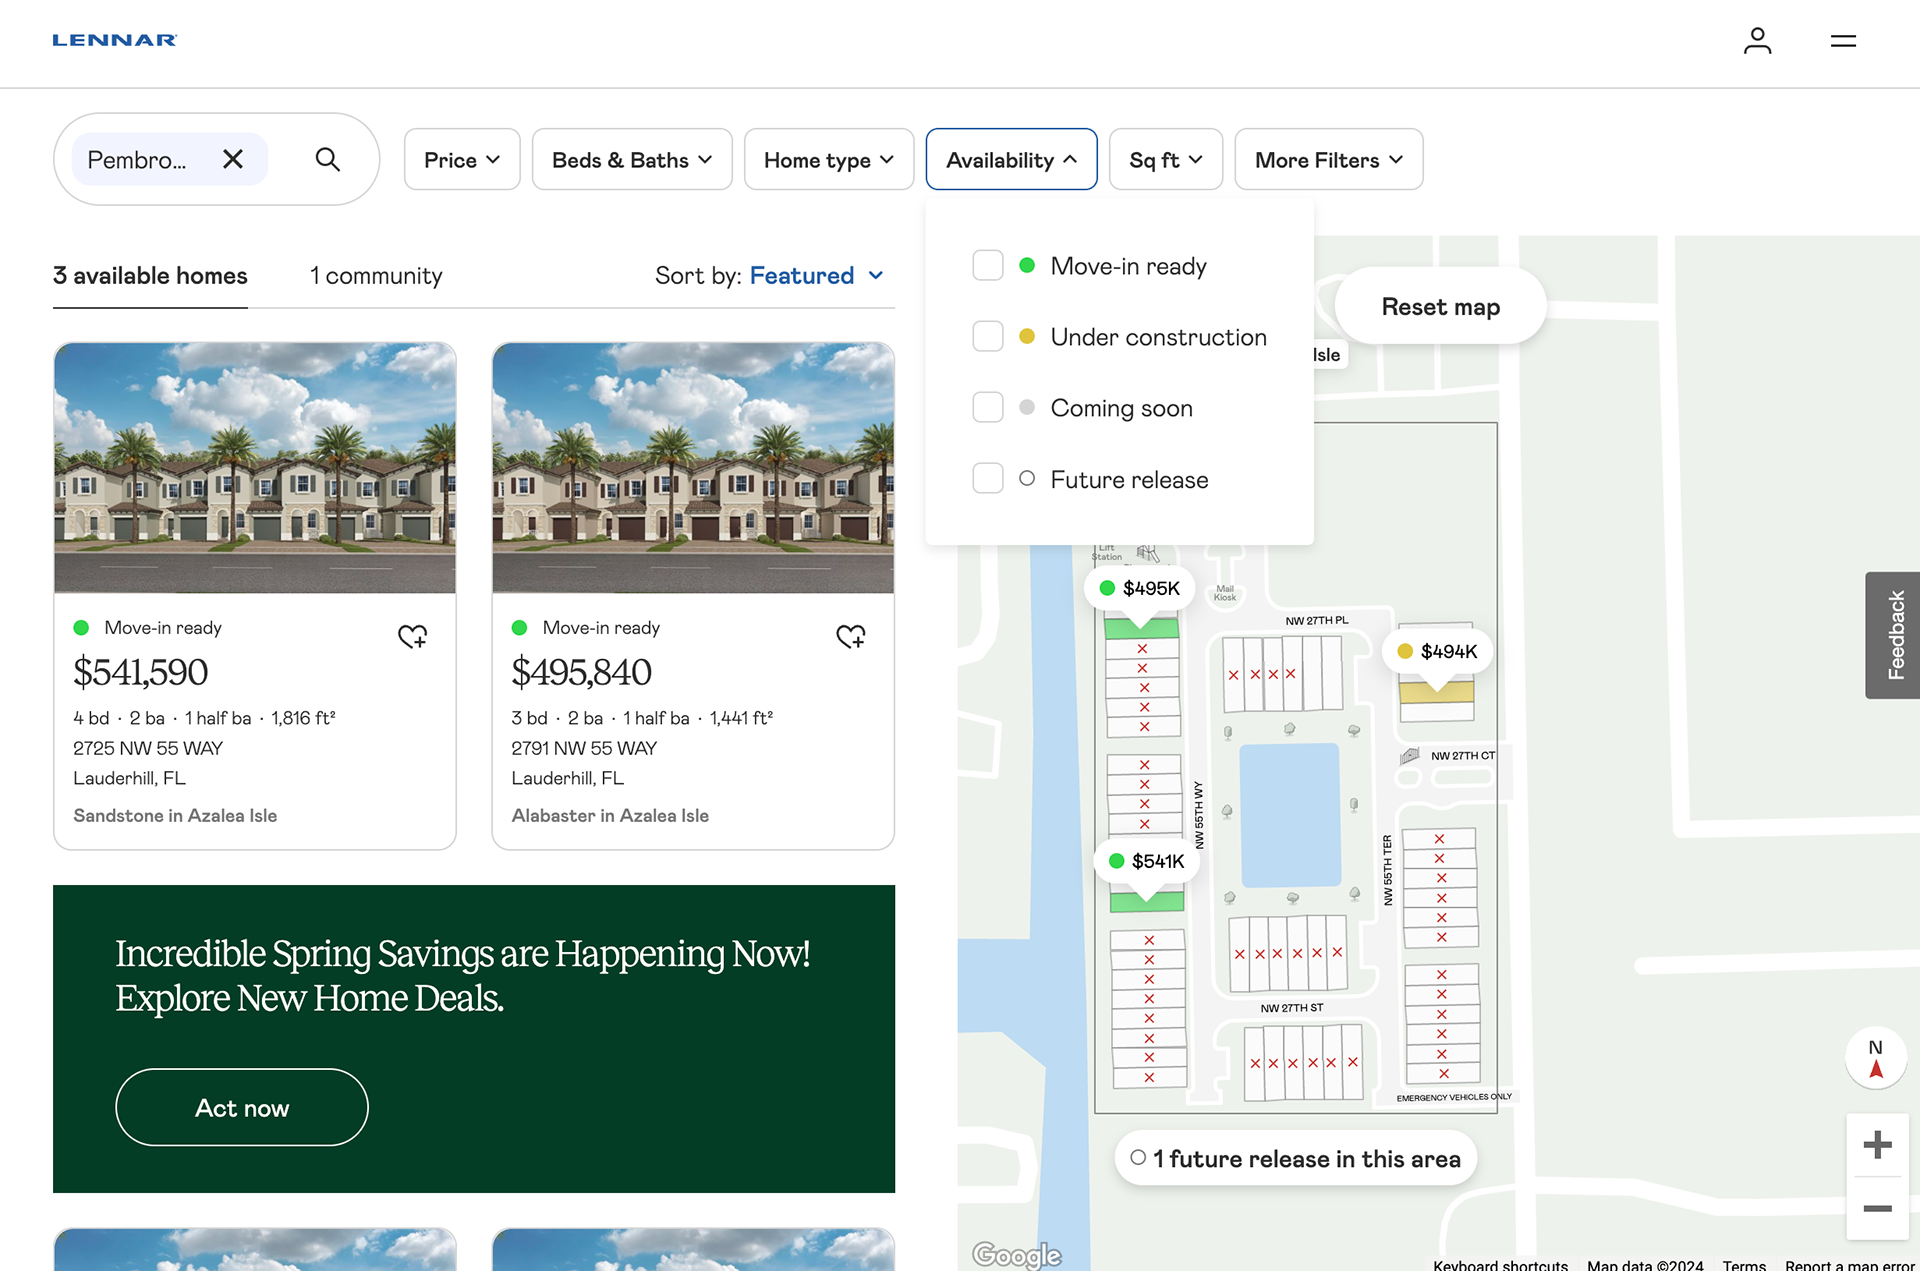
  <img src="/images/portfolio/lennar-interactive-maps/02.png" alt="Community site plan for a Lennar townhome community showing individual lot outlines, sold lots marked, available homes with price pins, and an availability filter panel open above the map." style="width:100%;border-radius:3px;" />
  <p class="caption"><svg class="icon sm"><use href="#i-bar"/></svg> <em>Figure 1</em> — Lot-level status on a site plan aligned to the architectural drawings.</p>
</div>

## § 03 — approach

### A conversion pipeline, then an admin platform, then the map

Over three months my team and I processed more than a thousand community maps.
We built a documented, repeatable conversion process combining command line tooling, GIS, and CAD, so each site plan was aligned to its architectural source rather than redrawn by eye.

The second half of the build was organizational: a bespoke backend administration platform that let sales managers publish availability changes themselves, fed by live sales data from the backend systems.
Once that existed, the map stopped being a document anyone had to update.
The front end renders regional search with clustered results down to lot-level pins, prices, and community features like pools, water features, and multi-family buildings.

<div class="metric-row">
  <div class="metric">
    <p class="n">1,000 +</p>
    <p class="l"><svg class="icon sm"><use href="#i-layers"/></svg> Maps processed</p>
    <p class="c">aligned to architectural plans via GIS + CAD</p>
  </div>
  <div class="metric">
    <p class="n">~ 3 mo</p>
    <p class="l"><svg class="icon sm"><use href="#i-clock"/></svg> From PDF library to live platform</p>
    <p class="c">including the conversion pipeline</p>
  </div>
  <div class="metric">
    <p class="n">0</p>
    <p class="l"><svg class="icon sm"><use href="#i-zap"/></svg> Designer hours per update</p>
    <p class="c">sales managers publish directly</p>
  </div>
</div>

## § 04 — reflection

### What carried over

The highest-leverage work was the documentation of the conversion process, not the map interface.
It turned a thousand one-off design jobs into a pipeline anyone on the team could run.
That is the claim I keep coming back to in agentic work as well: when an artifact has to stay current, the designer's job shifts from producing the artifact to designing the system that produces it.

Screens from the shipped product are in the <a href="/portfolio/lennar-interactive-maps">portfolio</a>.
