---
title: "Brand Impact Tracker: an agentic build, built agentically"
sector: "Fortune 100 industrial equipment manufacturer"
role: "Sr Solutions Architect"
duration: "Q1–Q3 2026, ongoing"
pillar: "Agentic delivery as method"
sub: "A custom generative analytics platform for a brand strategy team, designed, specified, and delivered agentically by one architect."
---

<figure style="margin: 8px 0 44px;">
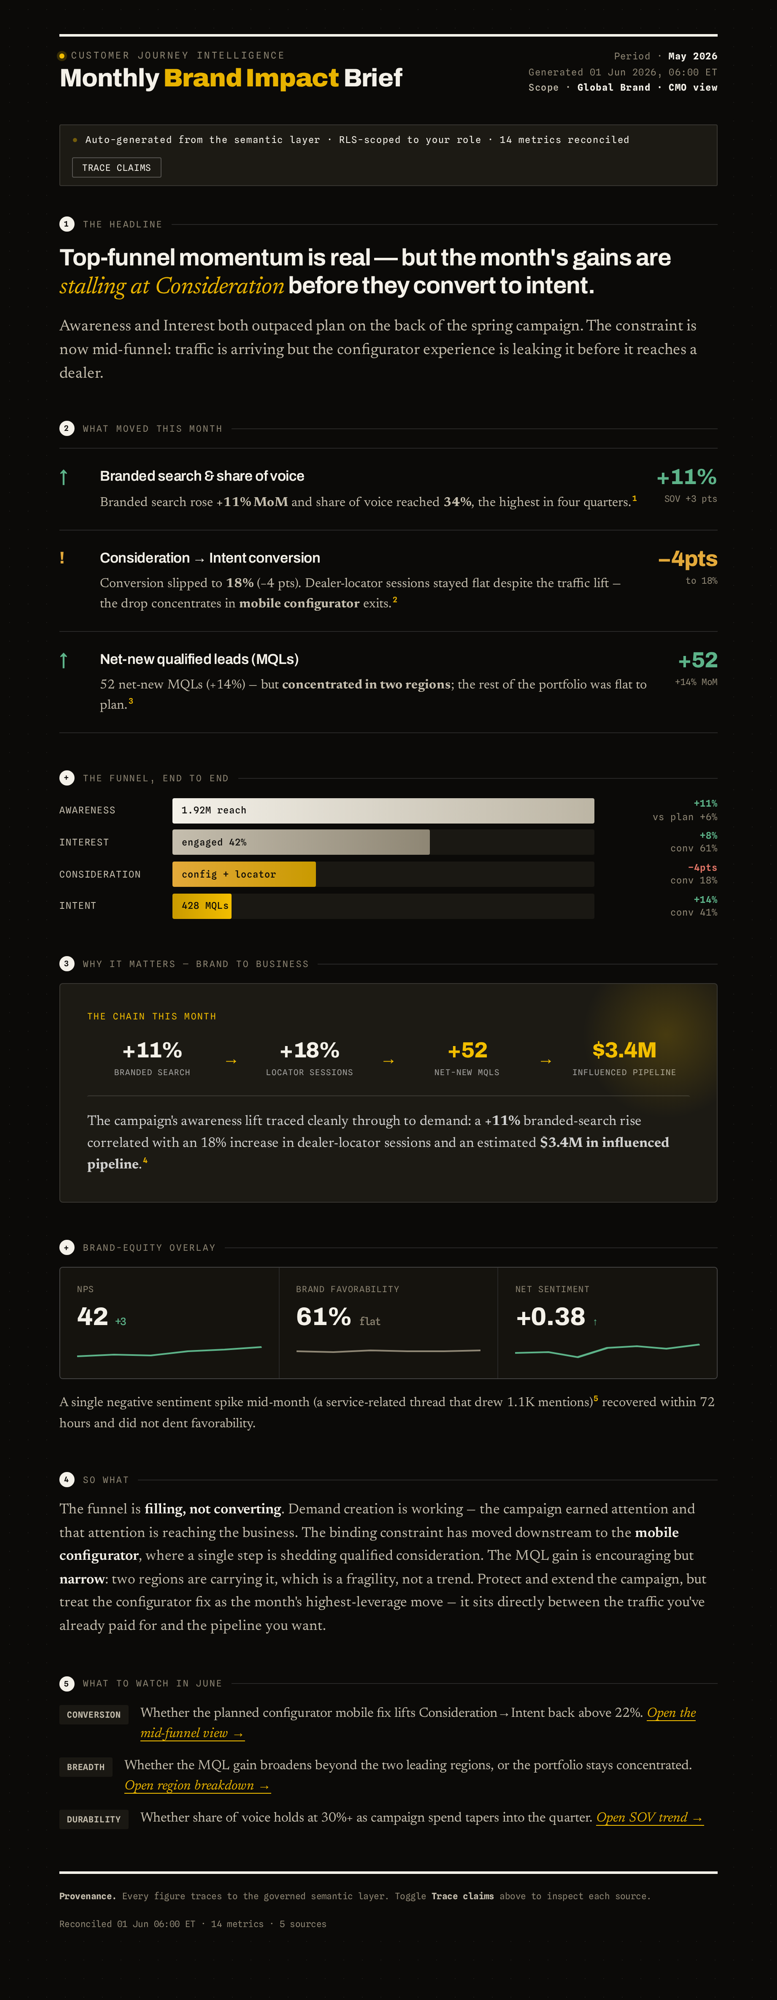
  <img src="/images/work/agentic-analytics-platform/hero.png" alt="Brand Pulse daily brief interface: a headline reading 'One signal needs a look this morning — paid-social engagement dropped overnight', an ask-the-data input, two attention cards for paid-social engagement and branded search, and a row of at-a-glance metrics." style="display:block;width:100%;border:1px solid var(--rule);border-radius:6px;" />
  <figcaption style="margin-top:20px;font-family:var(--mono);font-size:11px;font-weight:500;letter-spacing:0.06em;text-transform:uppercase;color:var(--ink-faint);">The daily brief surface: one signal surfaced, everything else within range. Mock data throughout.</figcaption>
</figure>

## § 01 — context

### Client context

The brand strategy team at a Fortune 100 industrial manufacturer: a company that reaches its market almost entirely through a global network of independent dealers, and measures brand marketing performance across that entire channel.

## § 02 — challenge

### The challenge

Marketing investment flowed across a full funnel, Awareness through Loyalty, but the team couldn't see it as one system. Behavioral analytics lived in one platform, leads and opportunities in the CRM, everything aggregating into the cloud data warehouse, yet there was no unified view of brand impact across funnel stages. Every ad-hoc question ("which channel dropped, and why?") entered an analyst backlog measured in weeks, so decisions lagged the questions that prompted them. And the dealers, the people who actually convert brand investment into revenue, could be served nothing at all: no existing BI tool could deliver a branded, multi-tenant, external-facing experience. Meanwhile the company had chartered an enterprise AI initiative whose ambitions the current reporting stack visibly couldn't meet. The stakes weren't dashboard aesthetics; they were spend allocated on stale answers and a distribution channel flying blind.

<div class="diagram">
  <svg viewBox="0 0 720 250" xmlns="http://www.w3.org/2000/svg" aria-label="Systems map showing where the generative layer intervenes in the question-to-new-view loop">
    <text x="20" y="22" style="font-weight:600">The system the dashboard sits in</text>
    <text x="298" y="46" class="dim">question → new view · analyst backlog · weeks</text>
    <path class="stroke" d="M 430 72 L 430 58 L 296 58 L 296 72" stroke-dasharray="3 4"/>
    <rect x="20" y="76" width="64" height="34" class="stroke" rx="3"/>
    <text x="34" y="97">data</text>
    <rect x="104" y="76" width="122" height="34" class="stroke" rx="3"/>
    <text x="116" y="97">semantic meaning</text>
    <rect x="246" y="76" width="98" height="34" class="stroke" rx="3"/>
    <text x="258" y="97">presentation</text>
    <rect x="364" y="76" width="132" height="34" class="stroke" rx="3"/>
    <text x="374" y="97">human interpretation</text>
    <rect x="516" y="76" width="76" height="34" class="stroke" rx="3"/>
    <text x="530" y="97">decision</text>
    <rect x="612" y="76" width="64" height="34" class="stroke" rx="3"/>
    <text x="626" y="97">action</text>
    <line x1="84" y1="93" x2="104" y2="93" class="stroke"/>
    <line x1="226" y1="93" x2="246" y2="93" class="stroke"/>
    <line x1="344" y1="93" x2="364" y2="93" class="stroke"/>
    <line x1="496" y1="93" x2="516" y2="93" class="stroke"/>
    <line x1="592" y1="93" x2="612" y2="93" class="stroke"/>
    <path class="stroke" d="M 644 110 L 644 140 L 52 140 L 52 110"/>
    <text x="316" y="156" class="dim">action → new data</text>
    <circle cx="296" cy="72" r="5" class="accent"/>
    <circle cx="28" cy="196" r="6" class="accent"/>
    <text x="44" y="200" style="fill:var(--accent);font-weight:600">intervention: make presentation generative — the loop collapses to seconds</text>
    <text x="44" y="222" class="dim">same data foundation; the interface is composed at question time</text>
  </svg>
  <p class="caption"><svg class="icon sm"><use href="#i-bar"/></svg> <em>Figure 1</em> — The feedback-loop system map, with the question-to-new-view loop as the intervention point.</p>
</div>

## § 03 — approach

### The approach

The engagement began as a narrower question: had the incumbent BI platform hit its AI ceiling? The evaluation said yes, and structurally rather than incrementally. The incumbent and its leading competitor both generate native visuals inside their own chrome; neither can deliver a conversational, generative analytics experience or a branded external distribution layer. That finding forced the first real decision: recommend a custom build without torching the incumbent. Its embed footprint across the CRM and intranet is load-bearing infrastructure, so rip-and-replace was rejected for a three-layer architecture: preserve the existing BI surface with inline AI affordances, add a purpose-built generative surface beside it, thread one AI capability layer through both. The pitch was grounded in the client's own AI charter rather than dissatisfaction with tooling, which kept the recommendation politically defensible.

The second decision was methodological: run the delivery itself agentically, so the process would demonstrate the thesis. Research surfaced two personas: the operational user who interrogates data weekly, and the executive who needs data composed into narrative on their cadence. The discipline was refusing to invent more. Encoded as markdown skills, the personas became executable: every screen composed as one, critiqued as the other, before human review. The engagement's strategy lives as a knowledge bundle (one concept per markdown file, cross-linked, conformed to Google's Open Knowledge Format) that agents execute from directly, so the strategy can't rot without the build breaking. Design quality is enforced by a curated craft stack (Impeccable, UI/UX Pro, Taste, plus custom-built skills) encoding hand-made design-system decisions: Fraunces, JetBrains Mono, Inter, dark grammar, brand via palette tokens only. Taste holds whether I'm watching or not. And the POC was treated as a requirements-extraction instrument, not a proof: silent demos, forced tradeoffs.

## § 04 — solution

### The solution

The Brand Impact Tracker: a custom Next.js application with the warehouse's native AI layer (Snowflake Cortex) as its intelligence engine. Cortex is the brain; the app is the branded body. Agent responses return as structured JSON and render as live React components on a generative canvas, not chatbot text. The information architecture is the two personas made structural: Finding, an atomic insight; Analysis, an on-demand interactive session titled by its originating question; Brief, a scheduled push publication for the executive. Built as a Turbo monorepo with scoped packages, a Storybook-documented component library, and enterprise identity-provider auth; delivered by one architect working with the client's data lead, whose pre-aggregated funnel stage tables made the semantic layer a vocabulary exercise rather than a rebuild. This was a two-agent build: Claude Code owned the application layer, Snowflake's data-native agent owned the warehouse side.

<div class="diagram">
  <svg viewBox="0 0 720 240" xmlns="http://www.w3.org/2000/svg" aria-label="The three artifact types: Finding flows into Analysis and Brief; Analysis graduates into Brief">
    <text x="20" y="22" style="font-weight:600">Two loops, three artifacts</text>
    <rect x="40" y="98" width="150" height="46" class="stroke" rx="3"/>
    <text x="56" y="117">Finding</text>
    <text x="56" y="134" class="dim">atomic insight card</text>
    <text x="420" y="26" class="label-italic">the operational loop — interrogation</text>
    <rect x="420" y="36" width="250" height="50" class="stroke" rx="3"/>
    <text x="436" y="56">Analysis</text>
    <text x="436" y="74" class="dim">interactive session, titled by its question</text>
    <text x="420" y="148" class="label-italic">the executive loop — narration</text>
    <rect x="420" y="158" width="250" height="50" class="stroke" rx="3"/>
    <text x="436" y="178">Brief</text>
    <text x="436" y="196" class="dim">scheduled narrative, pushed on cadence</text>
    <path class="accent" d="M 190 112 C 300 100 340 76 420 62"/>
    <path class="accent" d="M 190 130 C 300 142 340 166 420 182"/>
    <text x="256" y="94" class="dim">findings flow upward</text>
    <path class="stroke" d="M 545 86 L 545 158" stroke-dasharray="3 4"/>
    <text x="556" y="126" class="dim">graduates</text>
  </svg>
  <p class="caption"><svg class="icon sm"><use href="#i-bar"/></svg> <em>Figure 2</em> — The artifact taxonomy: the two personas, made structural.</p>
</div>

<figure style="margin: 44px auto; max-width: 540px;">
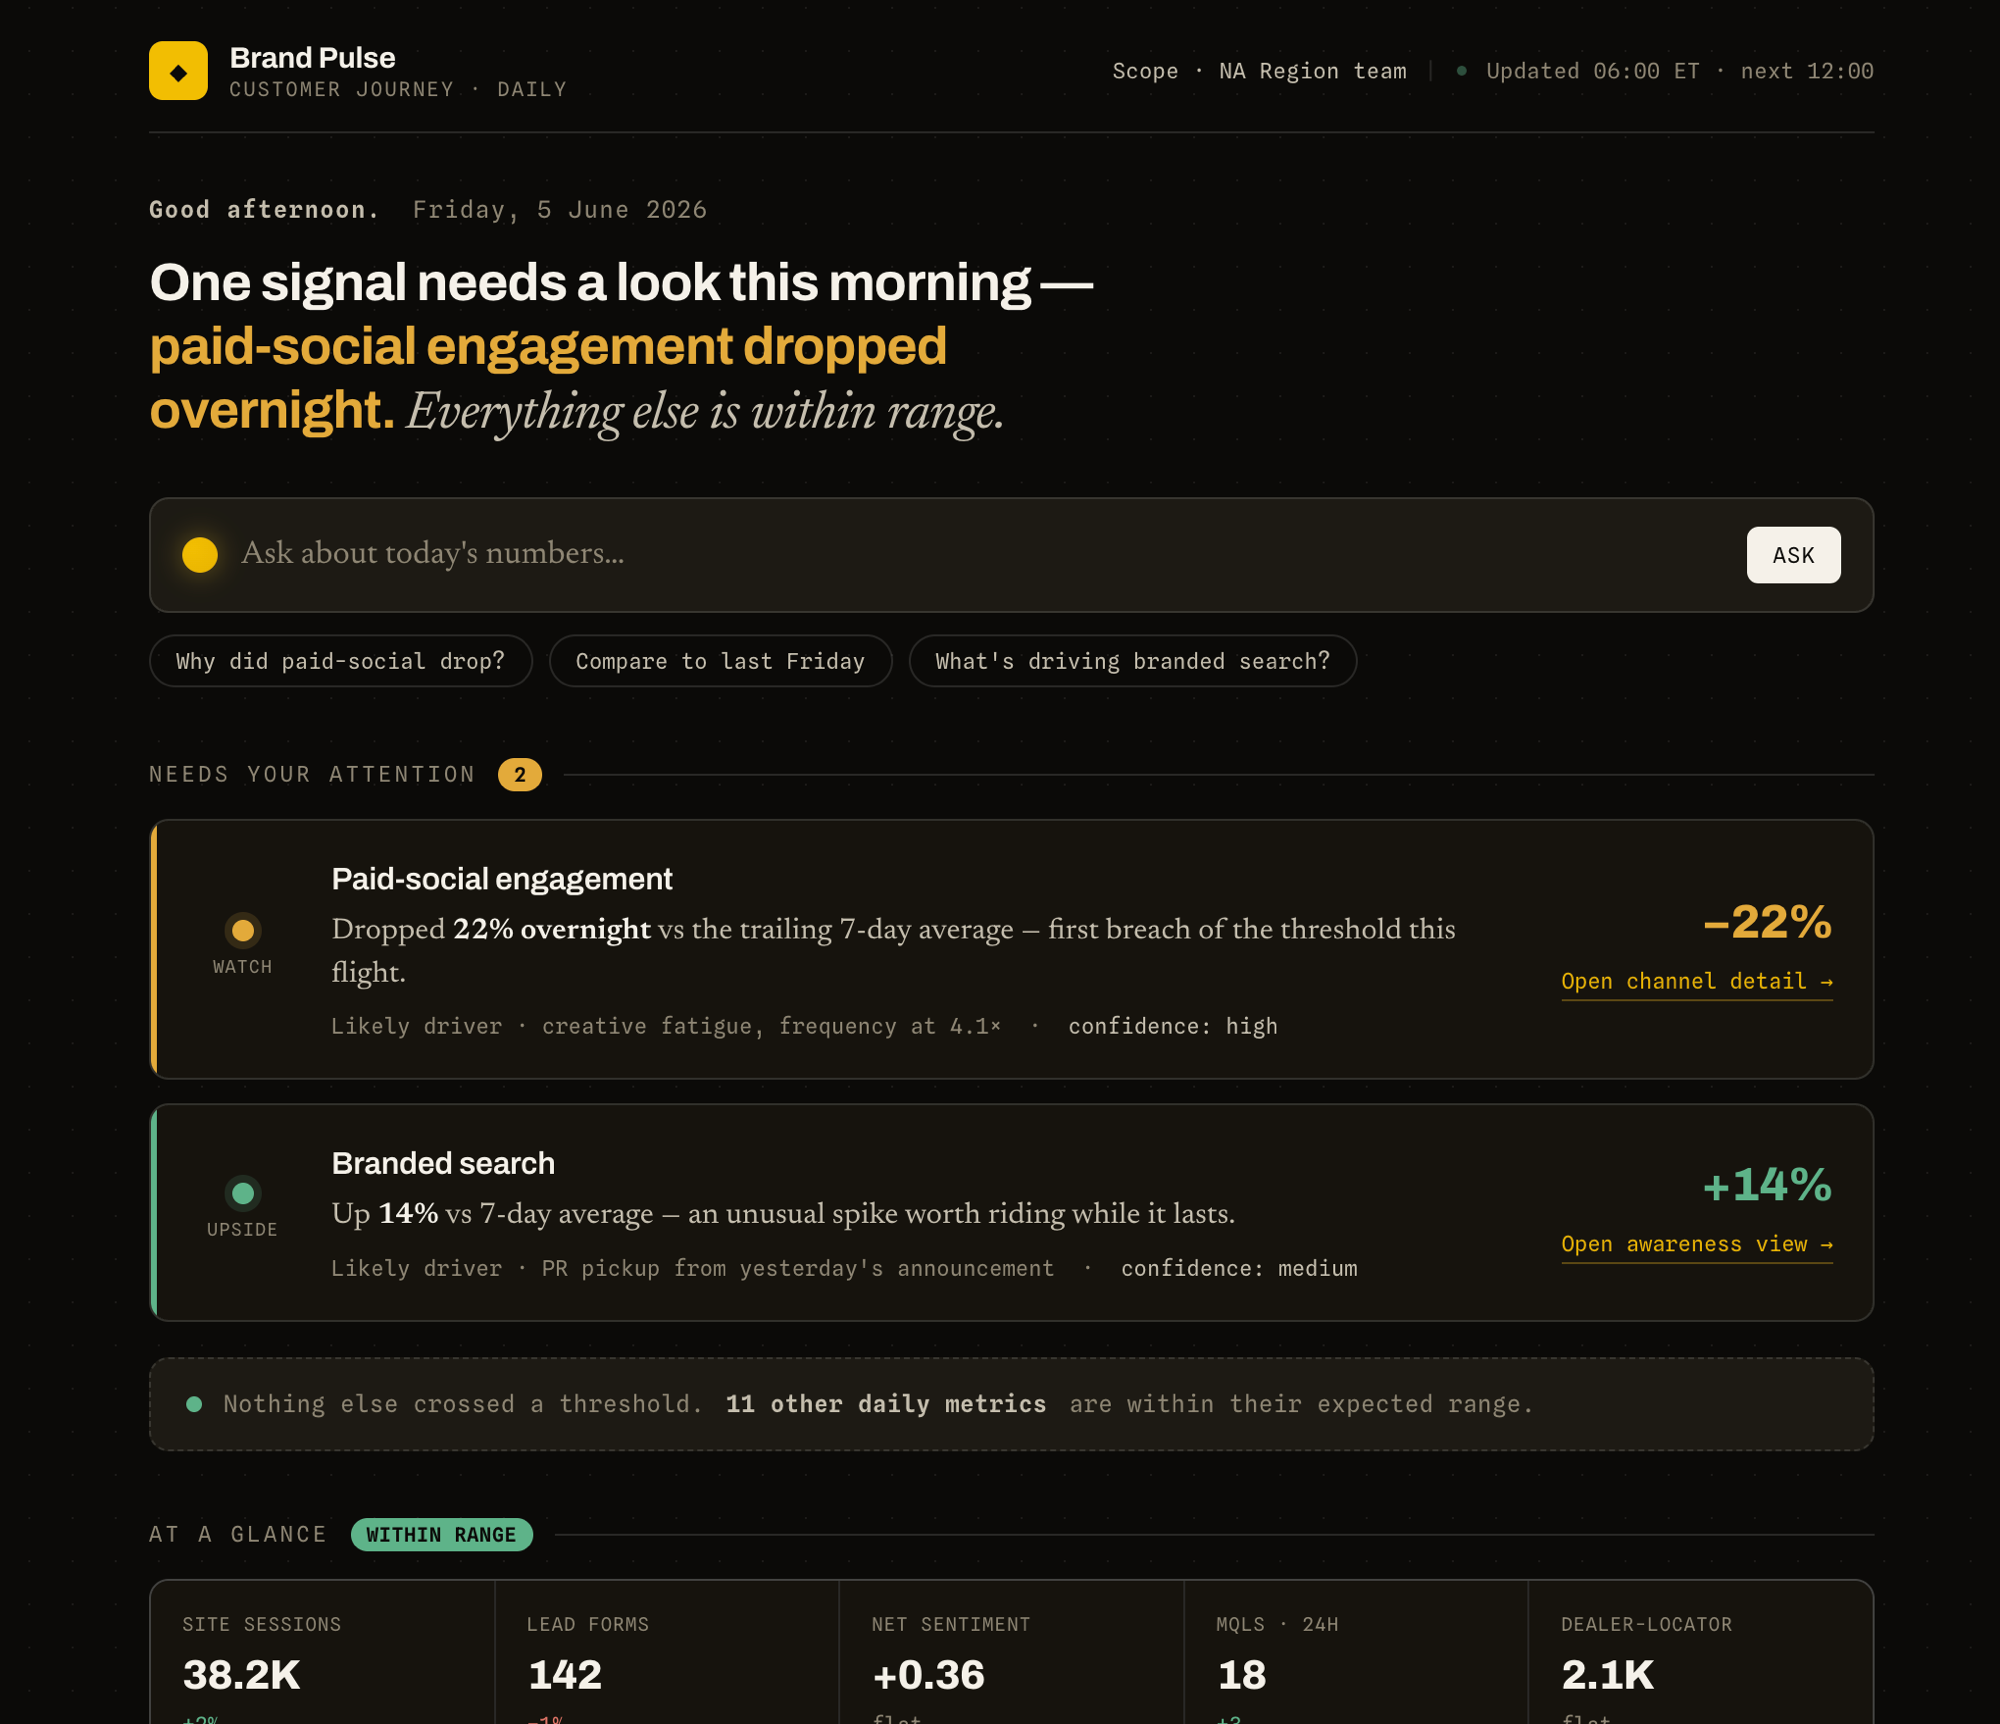
  <img src="/images/work/agentic-analytics-platform/monthly-brief.png" alt="Monthly Brand Impact Brief: a headline reading 'Top-funnel momentum is real — but the month's gains are stalling at Consideration', numbered sections for what moved this month, an end-to-end funnel view, a brand-to-business chain from branded search to influenced pipeline, brand-equity tiles, a 'so what' narrative, and what to watch next month — every figure traceable to the semantic layer." style="display:block;width:100%;border:1px solid var(--rule);border-radius:6px;" />
  <figcaption style="margin-top:18px;font-family:var(--mono);font-size:11px;font-weight:500;letter-spacing:0.06em;text-transform:uppercase;color:var(--ink-faint);">The Brief artifact: the executive's native surface, composed and pushed on cadence. Mock data.</figcaption>
</figure>

## § 05 — outcomes

### The outcomes

<div class="metric-row">
  <div class="metric">
    <p class="n">15</p>
    <p class="l"><svg class="icon sm"><use href="#i-layers"/></svg> Screens from one spec file</p>
    <p class="c">derived from 33 agent-analyzed dashboard screenshots; the spec was the work, the code was the printout</p>
  </div>
  <div class="metric">
    <p class="n">1</p>
    <p class="l"><svg class="icon sm"><use href="#i-user"/></svg> Architect, studio-shaped output</p>
    <p class="c">application, design system, component library, pitch materials, sprint playbook; work that conventionally staffs three to four roles</p>
  </div>
  <div class="metric">
    <p class="n">sec</p>
    <p class="l"><svg class="icon sm"><use href="#i-zap"/></svg> Question-to-answer loop</p>
    <p class="c">collapsed from analyst-backlog weeks in the demonstrated experience</p>
  </div>
</div>

And a standards-conformant knowledge bundle as a deliverable: the client's accumulated context outlives everyone's tooling choices.

## § 06 — reflection

### What this taught us

The generalizable insight: in agentic delivery, the durable asset is curated context, not the model. The brief, the build, and the handoff can share one substrate. The product rests on a semantic layer that gives an AI agent trustworthy meaning over warehouse tables; the method rests on a knowledge bundle that gives coding agents trustworthy meaning over the project. Same idea, two altitudes. Next on my list is an eval harness for the method itself: "the persona critique caught it" is still an anecdote, and the method deserves the same rigor as the product.

*Built with Claude Code, Snowflake Cortex, one OKF bundle, two personas, and an unreasonable number of markdown files.*